 iAttenuation
 iPhone app to calculate Tee Pi Balanced and Pad Attenuation Networks


X-Ray Flux
These graphs show the solar x-ray flux levels for the past three days, as well as the past six hours. A solar flare will produce a
dramatic spike in levels, these x-rays can ionize the D-layer of the ionosphere, causing HF radio blackouts.
Low frequencies are first affected, and higher ionization levels can affect the higher frequency bands.
The X-ray flux level is also affected by the overall solar activity level due to sunspots, which can be see in the baseline (non flare) levels. Higher values can result in better propagation on the higher frequency bands.


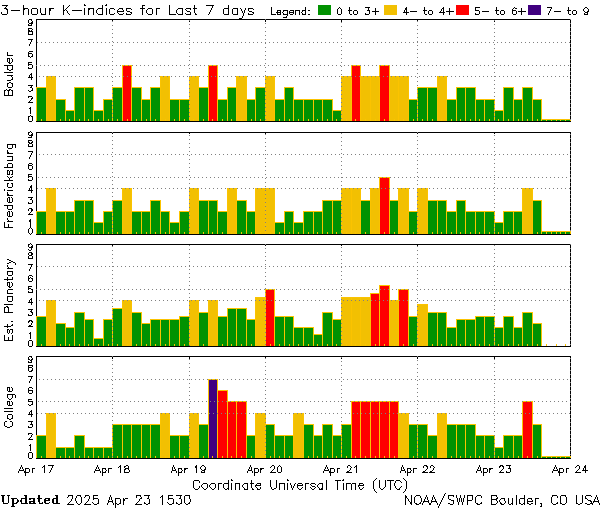
K Index
The K index is a measure of the stability of the Earth's geomagnetic field. The quietest level is zero, higher values indicate a
more unsettled geomagnetic field. Very high levels occur during geomagnetic storms. The index is log based, nine is the highest
value. Usually higher K index values suggest propagation will be poor, however sometimes you can pick up new stations.
Medium wave DXers call this "stirring the gumbo", when you hear a different than usual mix of stations.


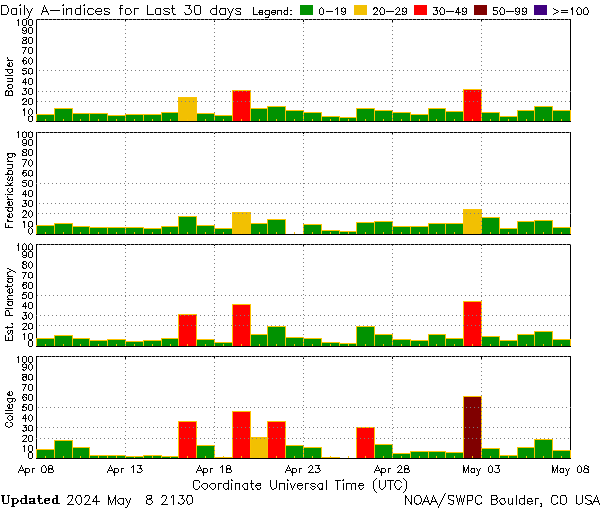
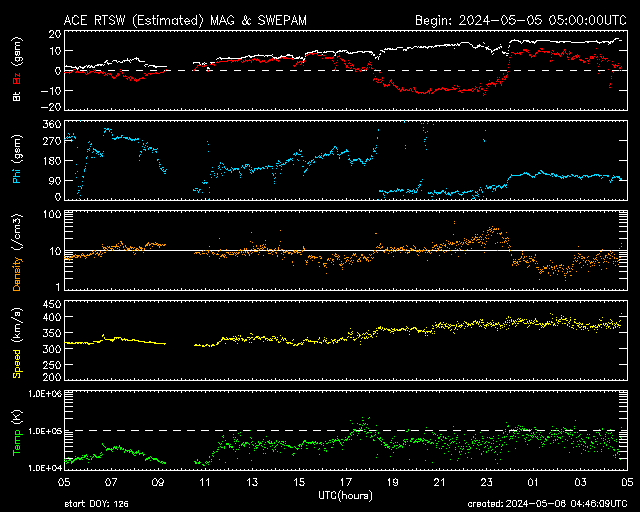
A Index and Solar Wind
The daily A index is the average of eight, linear (not log) three-hourly "a" indices.
Each K back into a linear scale called the "equivalent three hourly range" a-index.
The A-index provides a daily average level for geomagnetic activity.
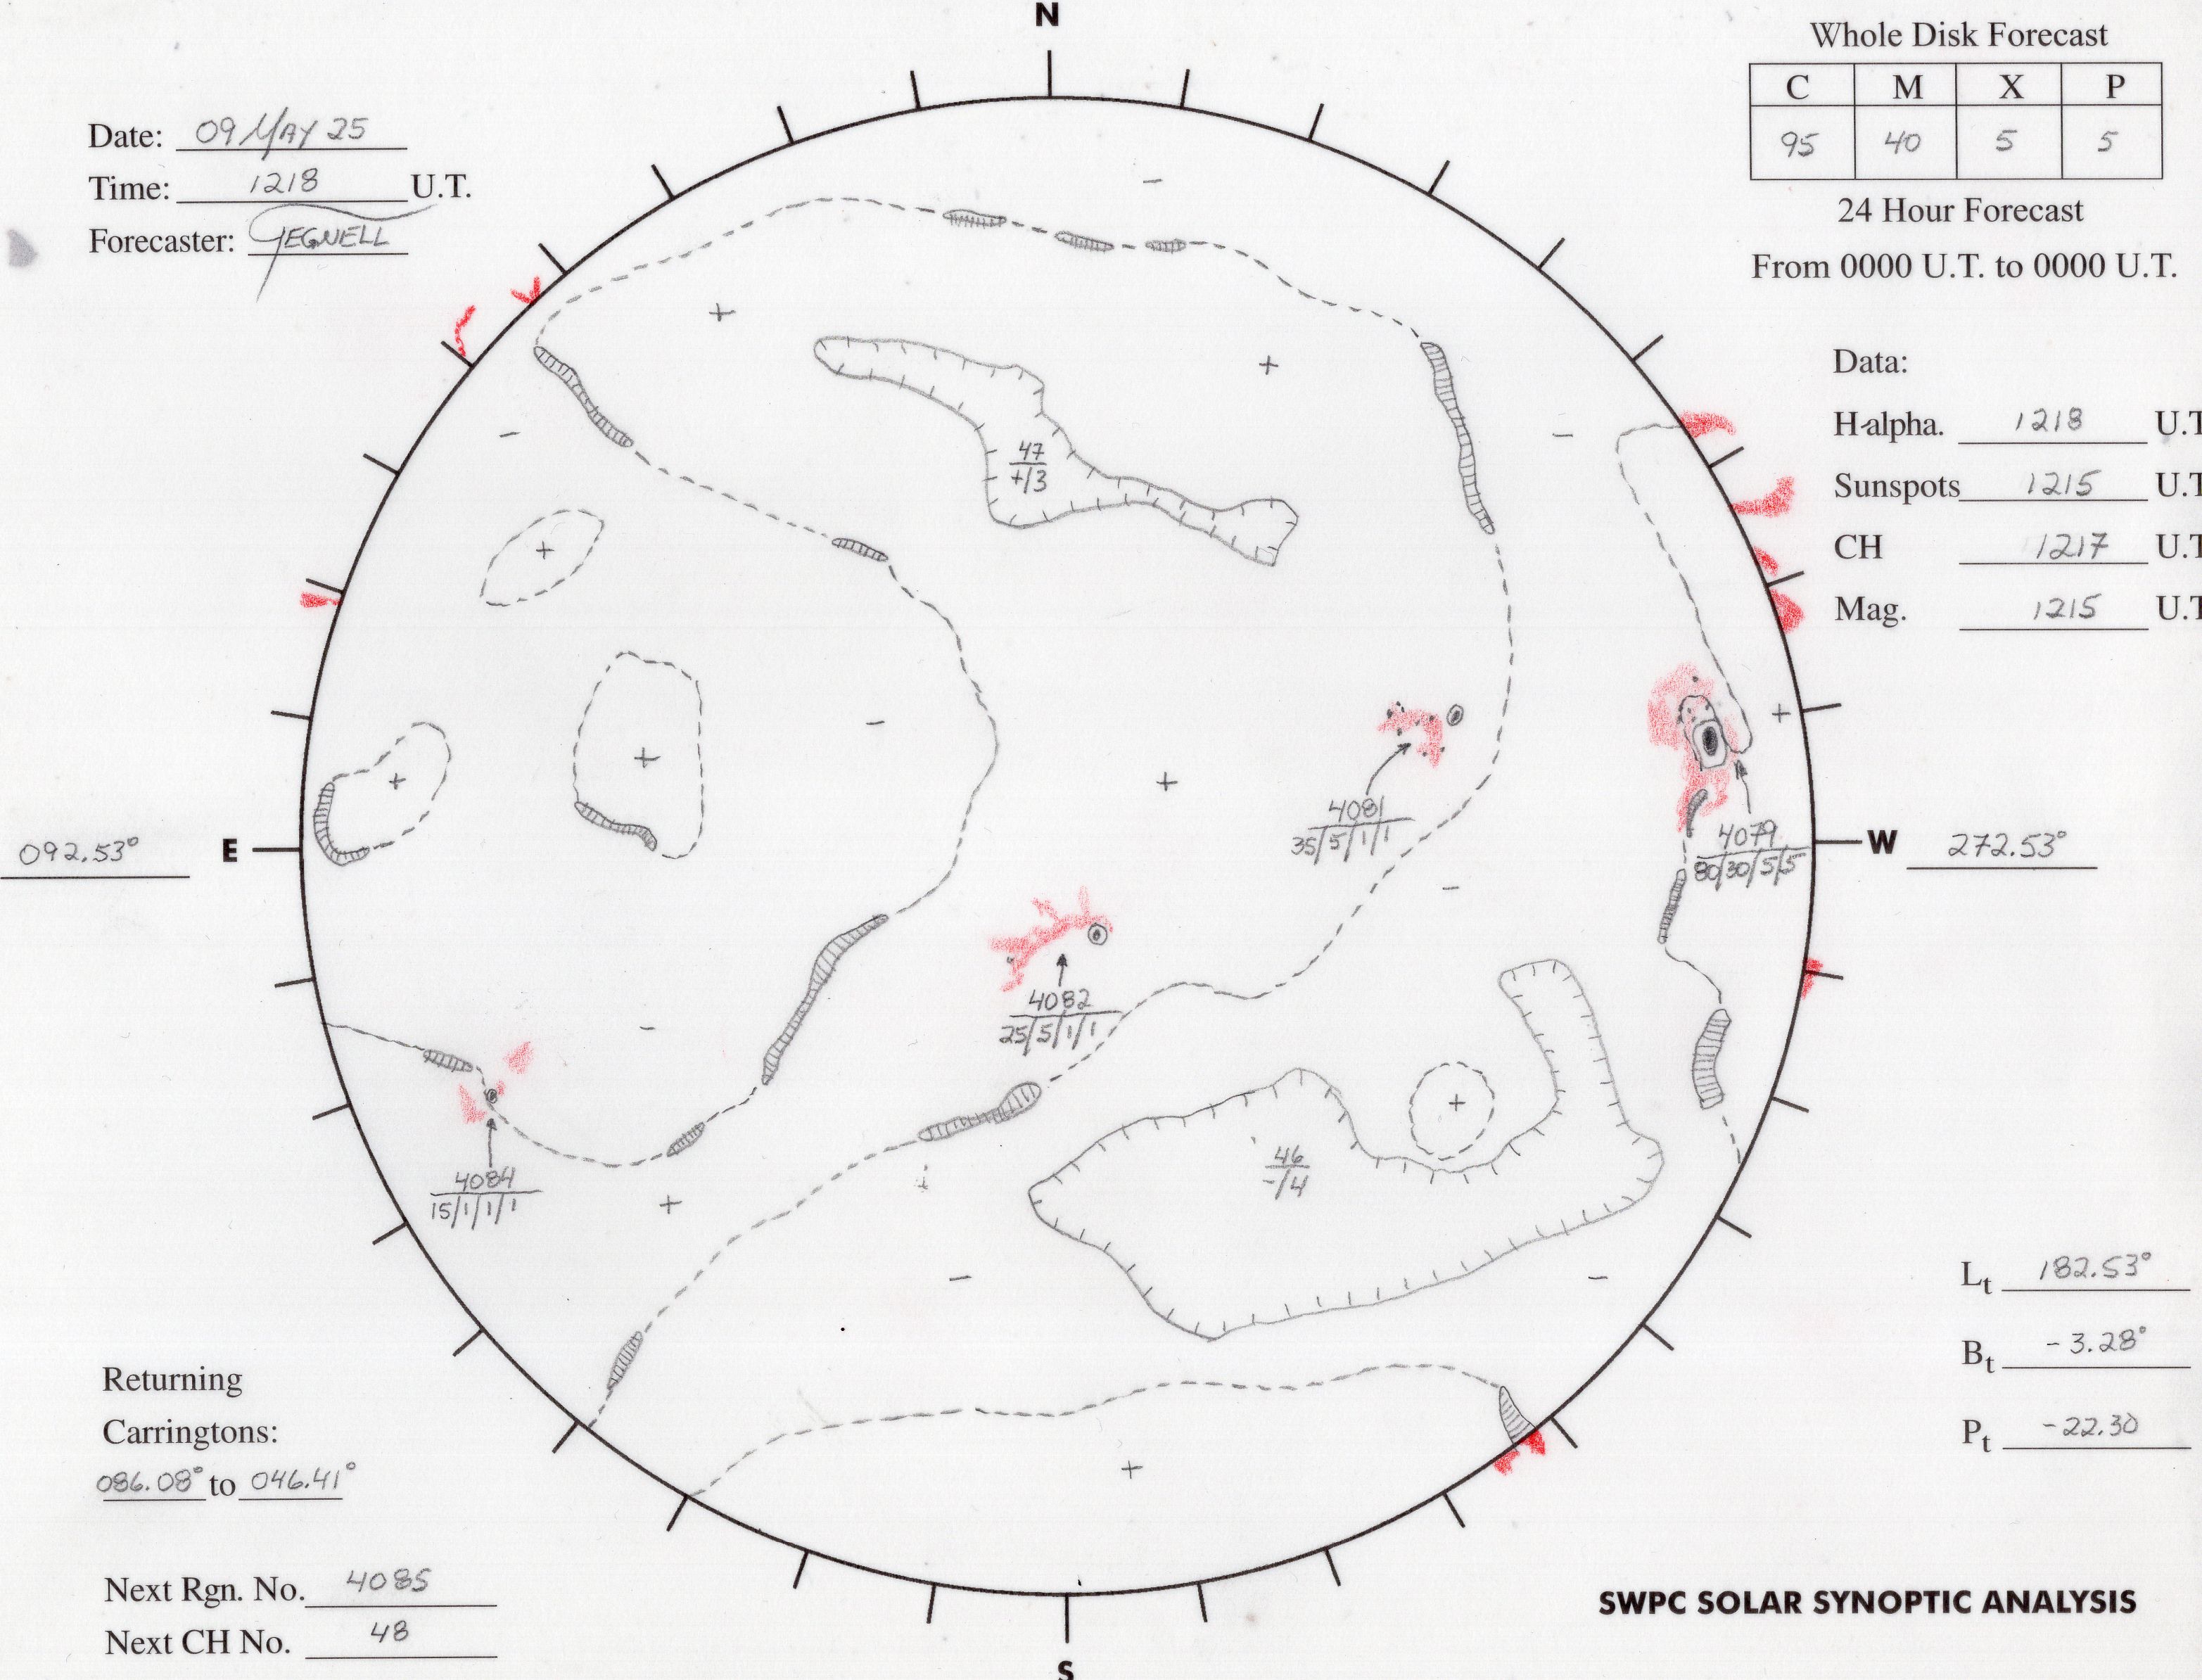
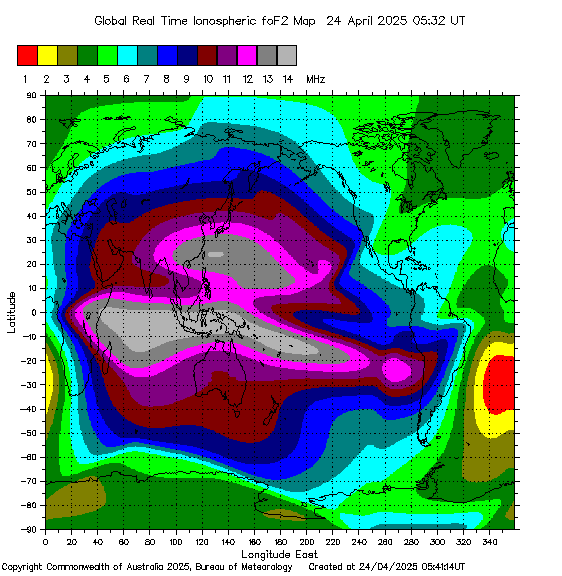
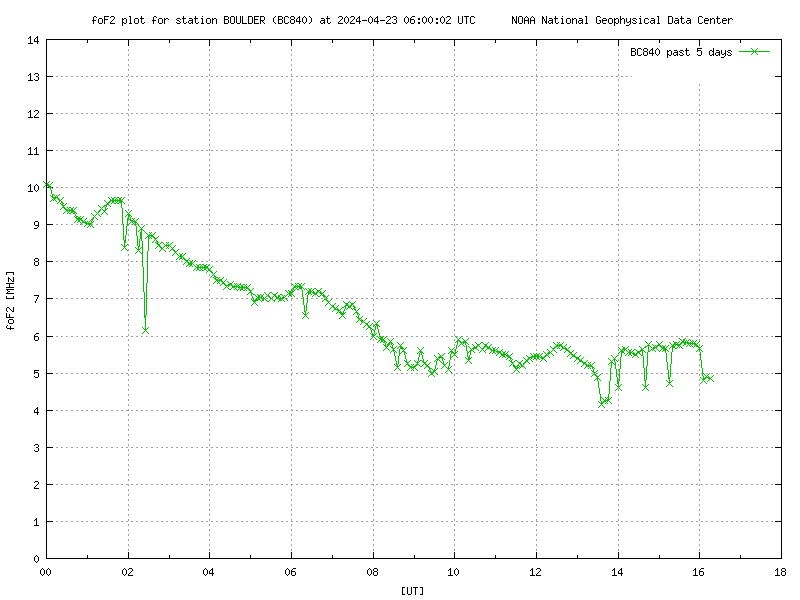
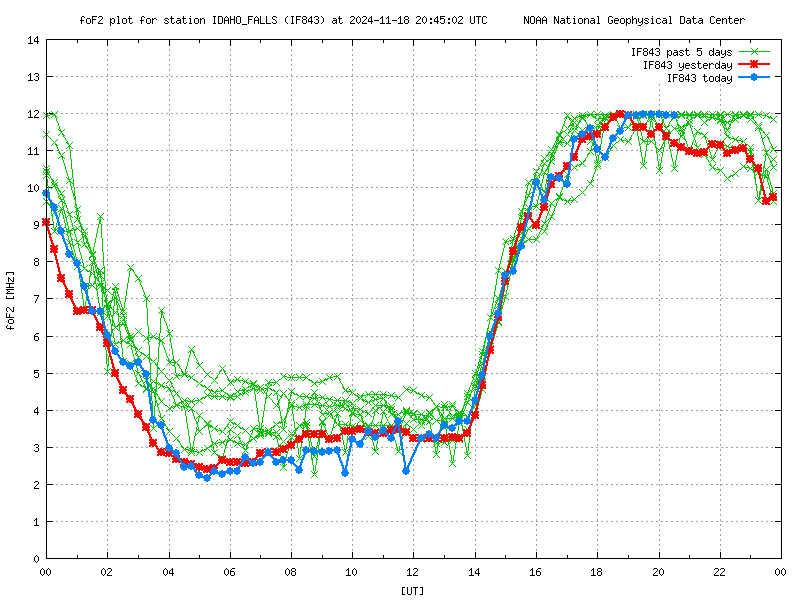
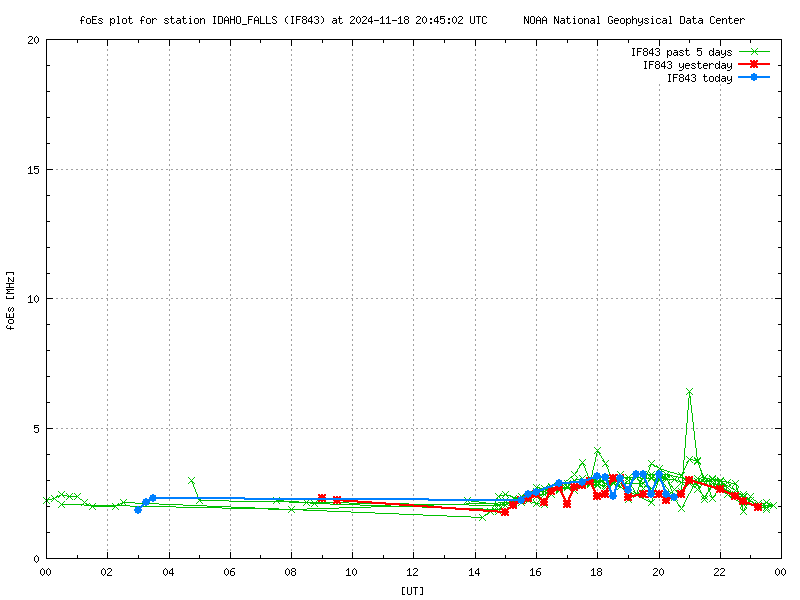
Ionosphere
These two graphs show the foF2 frequency and height of the F2 layer.
The foF2 frequency is the highest frequency which will be reflected back to the Earth with a vertical incidence (straight up and
down). These values can be used with the Skip Zone calculator below.


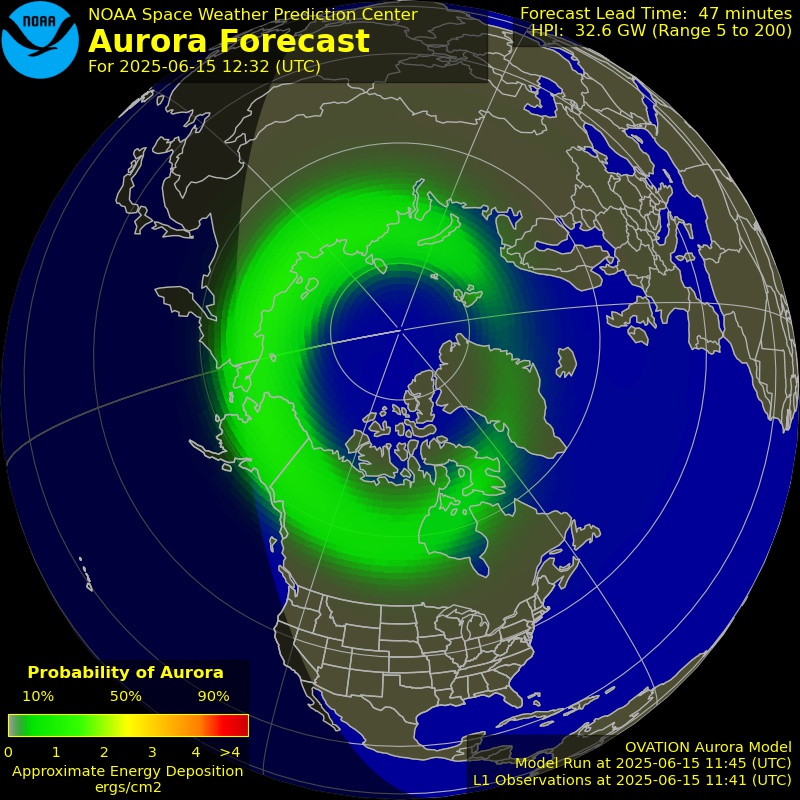
Aurora
This map shows the estimate aurora power level, and where it may be visible.
Longwave
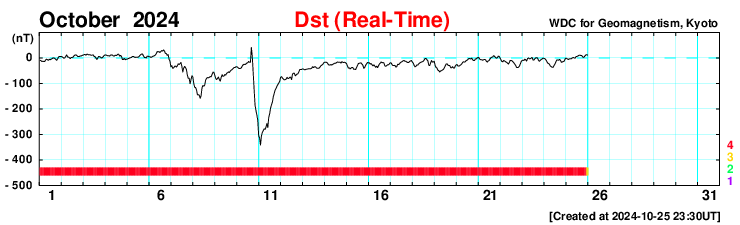
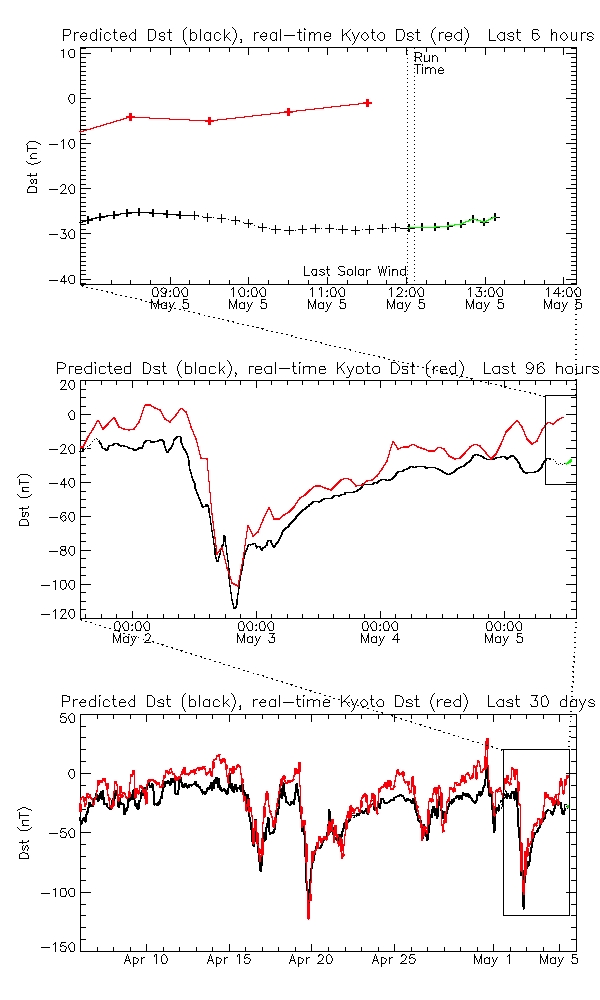
The Dst (disturbance storm time) index provides a measure of the Earth's geomagnetic activity.
It can be used to quantify the severity of magnetic storms.
Dst, expressed in nanoteslas, is based on the average value of the horizontal component of the Earth's magnetic field measured hourly at four near-equatorial geomagnetic observatories.
During a magnetic storm, the Dst shows a sudden rise, corresponding to the storm sudden commencement, and then decreases sharply as the ring current intensifies. Once the IMF turns northward again and the ring current begins to recover, the Dst begins a slow rise back to its quiet time level.
(Source: Hamilton, D. C., et al., Ring current development during the great geomagnetic storm of February 1986, J. Geophys. Res., 93, 14343, 1988.)
For longwave DXers, positive values, or at least those close to zero, are considered best.
The first graph shows Dst for the current month.
The second graph shows Dst for the last six hours.
The third graph shows Dst for the previous four days.
The fourth graph shows Dst for the last 30 days.
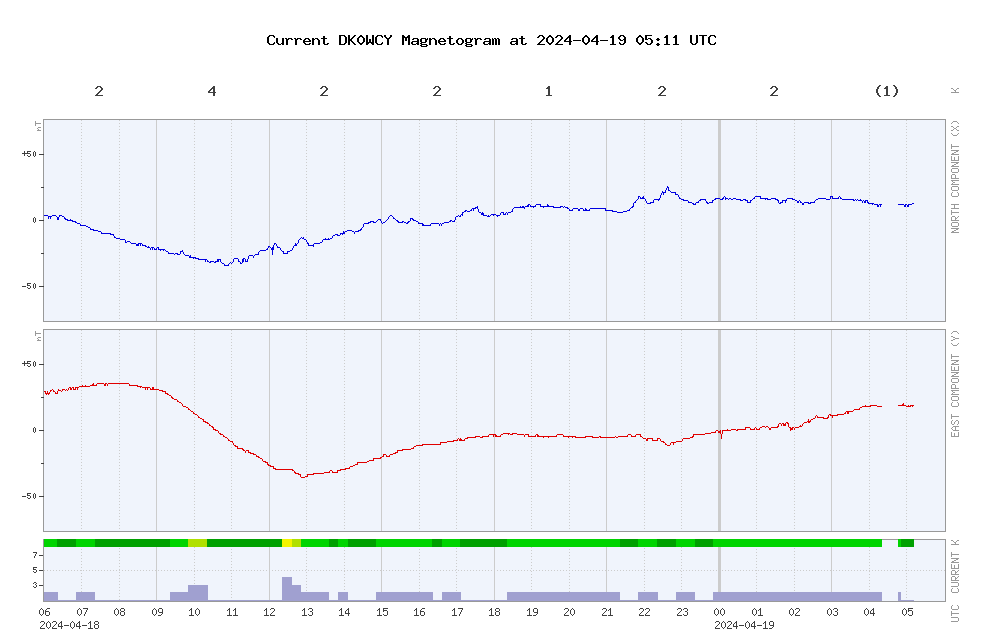
Notes on intepreting the magnetogram: http://dk0wcy.de/magnetogram/help_en.html
Skip Zone
The following will calculate the skip zone around a transmitter QTH.
Find the foF2 and hmF2 graph closest to your location, and enter in the current values,
(the end of the blue trace)
along with the transmitter frequency.
The estimated skip zone will be calculated.
The skip zone does not exist if the foF2 value is larger than the frequency.
Frequency: MHz
foF2: MHz
hmf2: km
Calculated Skip Zone: km miles


Geospace
New and experimental from the NOAA SWPC:
The Geospace Timeline Plot displays real-time solar wind values ballistically propagated from L1 orbit to the upstream boundary of the Geospace model, located at 32 Re (top four plots). The propagated solar wind values are then used to drive the Geospace model (SWMF) which outputs 1-minute predicted Kp and Dst values (bottom two plots). In addition to the forecasted values for Kp (green line) and Dst (white line), the ground truth data for Kp (SWPC estimated 3-hour Kp; teal line) and Dst (Kyoto 1-hour quick look Dst; red line) are plotted for comparison.
The vertical blue line indicates the current time, and the data plotted to the right of the blue line show the forecast for what we might expect to see at Earth in the near future. The Geospace model can provide Kp and Dst forecasts with 30 to 60 minutes advanced warning. Global activity indices, such as the geomagnetic activity index Kp and the disturbance storm time index Dst, are useful for a wide customer base as well as for indicators of how well the model is performing.


 39458 hits