We seek to understand and document all radio transmissions, legal and otherwise, as part of the radio listening hobby. We do not encourage any radio operations contrary to regulations. Always consult with the appropriate authorities if you have questions concerning what is permissible in your locale.

Show Posts

This section allows you to view all posts made by this member. Note that you can only see posts made in areas you currently have access to.


Messages - Token

Pages: 1 ... 120 121 122 123 124 125 126 127 [128] 129 130 131 132 133 134 135 136 ... 145
1906
Sounds like KDOOM testing on 6966 kHz at 0128 UTC, May 4.  First was some CW then voice, music, whistles, clicks and such as things were switched and adjusted.  Audio started out pretty bad but got a bit better.  Heard KDOOM ID in both voice and CW.  Signal was not bad, maybe S7 here.  Off about 0131 UTC, just a short test I guess.

T!

1907
Voice of Captain Ron Shortwave up on 6930 USB, 0110 UTC.  ID heard 0116 UTC, may have been one earlier.  Signal is about S4 and mostly copiable, but not real strong.

T!

1908
Wolverine for sure has used the first one before, almost two years ago.


I think both Outhouse and maybe GA-GA have also used it, but can't find their images right now.

T!

1909
North American Shortwave Pirate / Re: X-FM 6925 AM - 0200z
« on: April 27, 2012, 0326 UTC »
Really nice signal here in the Mojave Desert of California, most of the time about 10 over S9.  Nice wide and clean audio.  Transmitter bandwidth is a little over 22 kHz, audio bandwidth exceeds 10 kHz, probably closer to 12 kHz.

T!

(Edit)  Shout out to several, including me at about 0349 UTC.  XFM, I will upload a sample of the audio to my YouTube channel sometime.

1910
And the Op is in the Doghouse, so hanging out.  S8 to S9 here in the Mojave Desert.

T!

1911
"Don’t place too much on the video from YouTube for measurement, the compression and multiple handling in my making the video ..."

Sorry, but, you can't 'artifact' the kind of 'shifts' (lucky we are playing with elementary sine waves here and not something more complex!) I am seeing in the video. These (coding aberrations) would result in MAJOR distortions of sound (and we are talking a 'tone' here, pretty easy to detect/observe artifacts) ... try for instance looping (continually replaying) a segment that is continuous vs one of the segments that have the 'shift' and there is noticeable sound difference as well. Be sure to join ends of each segment as the sinusoid goes through zero in the same direction (otherwise MAJOR clicks are introduced; 180 degree phase changes make for a pronounced audible artifact).

What I said was accept that the video has been handled multiple times, and it might not be a 100% exemplar of what was heard for the entire time the transmissions were on the air.  I did not say the shifts you are seeing are not there, nor did I claim any “artifacts” were causing them.

What I can say FOR SURE, since I made the video and have the original files, is that playing the video back using the same receiver settings as in the video and looking at the detected audio in any program at all, results in different pulse widths than when I look directly at the I/Q data.  I suspect this is probably because of the AGC, but really am not all that worried about it.  When I said “about 70 ms” I was not attempting to quantify exactly, as opposed to when I said 3.00 sec pulse-to-pulse (actually what I saw over hundreds of pulses was 3.000 sec +/- 2 ms, typically no more than 1 ms, and most often 0 ms, from first detected energy to first detected energy in the I/Q recording).

Also, when I look at different segments of the I/Q recordings I see further variations in pulse duration.  Pulse durations measured, using the -10 dB point you quoted as the point of measurement along both the rise and fall, anything from 59 ms to over 80 ms.  Over the just under hour or so I recorded the pulses where “about” 70 ms, while the period of the video, grabbed at random, happens to average out a little shorter than that.  Yes, I understand what you are saying about the delayed pulses lengthening the overall pulse, but that would not account for SHORTER pulses than 64 ms.

This (the short pulses) is one of the reasons I think the pulses may have, let me say again, may have, varied in width over time.  Think outside that one short recording and over larger periods of time.


(Signal process much? ... I'm thinking maybe "no" ... please don't impose your limitations on others if your ability in an area might be a bit 'short'.)


You would be incorrect, however I do not profess to be an expert in the field.  A working knowledge of it as applied to such things as DSP based Doppler radar receiver processing, phase noise measurements, and “simple” things like the development and fielding of multiple phased array radar systems, yes, we do a little signal processing in those.

Nice attitude, considering I have not disagreed with you on anything other than the possibility of this coming from a single transmitter and to say that the pulses MAY not have stayed stable in width over extended periods.  Even then I did not say you were wrong about multiple transmitters, I only said a single source could also result in the same affect and that I tend to lean towards one TX.

However, when talking about RF, multipath, and how it affects pulses, both direct and reflected, I have more than a little experience, call it 35+ years worth.  And what I said was that while multiple transmitters could account for what you are seeing multipath and a single source also could.  The same transmitted pulse from a single source can arrive at the detector with multiple propagation delays, resulting in smearing or lengthening the signal, particularly detectable on the trailing edge of the pulse.  This can be indistinguishable from a separate transmitter in the short term and results in exactly the same kind of phase shifts when the “first” pulse ends and the “second” pulse is detected under it.  I see this every day, well, at least every workday.

The fact that not once, in hundreds of pulses, did the leading edge smear or change from the 3.00 sec pulse-to-pulse timing suggest a single source and multipath to me.  In all of those pulses, with the fading seen (including deep enough fades to make the signal undetectable), it is most likely that at least one time the path to the “shorter” distance source would have faded while the path to a “longer” distance source would have not, resulting in a change in pulse-to-pulse leading edge timing for that cycle.  This should eventually be true for a multipath single source environment also, but is much more likely when dealing with multiple geographically dispersed sources.

I am not questioning, and have not questioned, what you are seeing on the pulses or the time you came up with.  All I am saying, have said, is it does not take multiple sources to cause the same affect.  I also am not questioning your average pulse width findings for that section of video, and yes I understand, and have from the beginning, what you mean by:

“Perform the PW measurements taking into consideration where the individual 'sinusoidal sources' are seen to overlap/interfere and your 'pulse width' starts to converge on more like a uniform 64 ms value ...

Hint: Use either a virtual 'ruler' or something actual and measure zero-zero crossings or peak-peak crossings of the 'signal' ... you will see where the apparent 'phase' changes in an otherwise contiguous series of zero-crossings or sinusoidal peaks near the beginnings and near the ends of the 'pulse' ...  “

Just so you understand, I can see the same thing you are describing in the I/Q data.  You can see the transition from one pulse to the “delayed” pulse under/behind it.  In fact, for a few pulses you can see when the delayed pulse gets added to the early pulse, giving a nice reference point (both leading edges, since the trailing can be smeared) to measure the propagation delay difference between the two pulses.

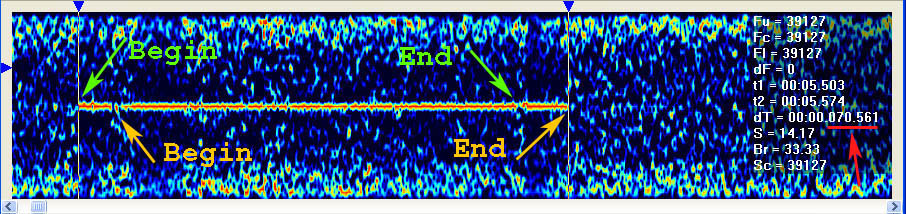
This is an example of what I mean.  A single pulse.  Not during the video segment I put on YouTube, but about 12 seconds before that started and on the same frequency (and with the same 64’ish ms pulse lengths).  The total pulse width is about 70.56 ms (first detected energy to last).  But, you can clearly see there is more than one pulse here.  Both pulses are about 64 ms long, but the second pulse starts about 5.6 ms after the first.

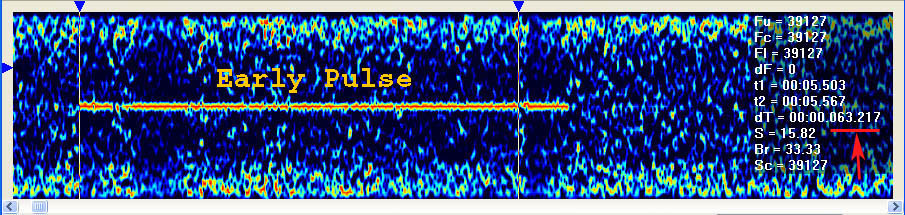
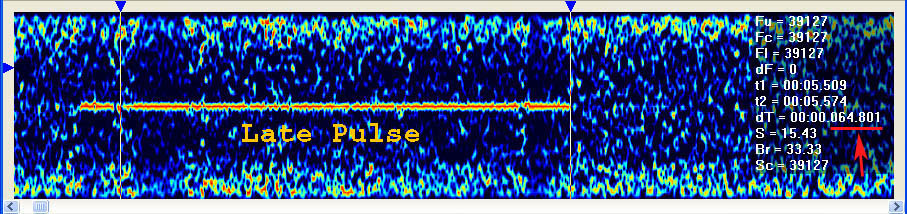
Picture 1 is the marker indicating the ends of the combined pulse, and the parts of each pulse.  Picture 2 is the markers only on the first pulse.  Picture 3 is the markers on only the late pulse.  If you subtract the “t1” of Picture 2 from the “t1” of Picture 3 you get 6 ms, rounded to the nearest full ms.  Actual delay is more like 5.6 ms.  The fact that the late pusle is longer than the early can also be explained by multipath pulse stretching.


And the fact that this delayed pulse is not consistently delayed (it appears variably from 2 to 11 ms behind the first pulse leading edge) argues against multiple transmitters.  In the case of two transmitters you would have two “shortest” paths, and so the most repeated paths.  And while you might get multipath smearing from each of the two transmitters you should essentially always get the shortest path also.  This should show up as a fixed delay between the two pulses for the strongest portions of each.  I don’t see anything really indicating such a fixed delay.  Of course, if there were many transmitters such a step might get lost, as you could see different ones at different times.  But, you would think that occasionally you would see several in a row from the same pair.

On the other hand, the wide region hearing these pulses might support multiple TX sites, but then so could good propagation.  Another indicator to support multiple transmitter sites would be the 5.6 ms delay in the pictures I posted above.  1 ms is roughly 300 km, so 5.6 ms would be roughly 1700 km.  One single transmitter having a multipath component that travels 1700 km further than the most direct route to me is less likely than two transmitters, one of them 1700 km further (path length) from me than the other.  Remember, I knew this when I first mentioned a single TX was the way I was inclined to think, and I still lean towards the single source based on the unvarying leading edge timing.  My point was that there is more than one explanation for the events you are seeing on the tail of the pulse, and that alone does not mean multiple TXs, although it is good ammunition.


T!

1912
... appears to be a 64 ms pulse width (at about the -10 db point)  at least for the 20 pulses shown on the YouTube video ...

Some of the bursts appear longer, but, that may also be due to more than one simultaneous sources and the delay between them. Upon close inspection of the leading and trailing edges of the waveform there is some non-homogeneousness to the sinusoid series: a change in 'phase' due to co-channel (same channel) signal 'interference' can be definitely noticed as either one signal or the other ramps up or trails off.

Conclusion: More than one source, and the temporal difference translates into a spatial difference (i.e. the spacing of the two sites is calculable).

.


Don’t place too much on the video from YouTube for measurement, the compression and multiple handling in my making the video and then YouTube doing what they do to convert it might lead to issues.  At least take it as an exemplar that might not be 100% representative.  Also remember there was a receiver AGC applied for that recording, although I had a fast rate set, the attack and decay are not at the same rates.

The pulses were variable, that is why I said “about 70 millisec”.  Looking at the I/Q data you can see much more detail than in an audio/video recording.  Taking a different sequence of 20 pulses from the ones presented on YouTube, from about 20 minutes earlier, and measuring in Signals Analyzer, no AGC applied, signal from start to extinction (without AGC the pulses are pretty square, especially on leading edge, the rise times are pretty quick and fall times slightly longer, some with noticeable frequency drift, but not step, for the last few milliseconds):


(LSB to .2 ms)

66.2 ms
70.6 ms
72.9 ms
66.5 ms
72.0 ms
70.8 ms
69.4 ms
72.3 ms
72.3 ms
69.1 ms
67.1 ms
69.1 ms
73.7 ms
68.8 ms (sharpest rise/fall of the set)
67.1 ms
67.4 ms
66.8 ms
66.5 ms
78.6 ms
87.0 ms (very possible multipath)

Pulse spacing was dead on the money 3.00 seconds +/- 1 msec but the end of the pulse varied in time, i.e. the pulse duration.

This could be explained by multiple sources, the closest (shortest distance) always arrived first and set the start time while masking the leading edge of any propagation delayed pulses.  It was also always the strongest, making for a nice sharp start.  But on the falling edge propagation could possibly make other pulses that are delayed blend with the end of the first pulse, varying the trailing edge depending on propagation characteristics and propagation delay to the “other” source.  But, this would assume multiple other sources, not just one or two, or we would end up with only a few “steps” in pulse duration (steps being equal to however many sources you can receive at your location).  Since I ended up with many different pulse widths, not just a few, I would doubt that propagation delay from other fixed sources is lengthening the pulses.

Personally, I lean more towards a single source and multipath causing the pulse duration deltas, or they simply vary a little in length at the source.  The varying lengths without pronounced or common steps have me pretty convinced.  Not that I think multiple sources is impossible, just that I think either multipath or variable at the source is more likely.

1913
HF Beacons / Re: Dashes on 6923
« on: April 20, 2012, 1514 UTC »
Not maybe, the Link 11 on 6940 USB is back and huge this morning.

T!

1914
HF Beacons / "W" Windy back, 4102.3 kHz, 04/20/2012, 0050z
« on: April 20, 2012, 1252 UTC »
It would appear that the "W" Windy beacon is back up on 4102.3 kHz.  Have not seen this one for a while, I had heard something about it being damaged.  Back up and beeping rates changing with the wind speed again.

T!

1915
HF Beacons / Re: 6820 beeper beacon
« on: April 18, 2012, 1520 UTC »
See my posting:
http://www.hfunderground.com/board/index.php/topic,6904.0.html

I note that it stopped at 0338 UTC, but I also stopped listening right after that, and it could have resumed by the time you note.

This is an unusual signal, every freq was in sync and simulcast.

T!

1916
Last night an unusual signal was reported in IRC.  Not an uncommon occurrence ;)

A CW “Pip” was reported on multiple frequencies at the same time first noted about 0247z.  These pips were CW bursts about 70 milliseconds long occurring every 3.00 seconds.  They were on multiple frequencies all in synchronization and simultaneous transmissions.  The frequencies ranged from below 6 MHz to above 12 MHz.    The frequency spacing of the signals were clearly defined and changed as the frequency increased, from each 90 kHz at the low end to each 150 kHz at the high end.  All frequencies were not found, as the signal terminated while I (and others) was trying to define all the frequencies.  All frequencies terminated transmission at the same time (0339z).

They were heard all across the USA, from New York to California, and Washington to Florida.

Video of one frequency as received at my location here:
http://www.youtube.com/watch?v=jBtMxRIcyFg

The known frequencies were:
5670, 6150, 6240, 6330, 6420, 6720, 6820, 6920, 7020, 7130, 7240, 7460, 7570, 7680, 7800, 7920, 8040, 8160, 8280, 8400, 8530, 8660, 9050, 9190, 9900, 10200, 10350, and 10510 kHz.  28 defined frequencies in my log.  Reports were received of it operating above 12 MHz, but the signals stopped when I had only found them up to 10510 kHz and unfortunately I did not note in my log the specific frequencies others were reporting.  If you note the pattern of the frequency spacing you see that:
 6150 to 6420 was spaced each 90 kHz
6720 to 7020 was spaced each 100 kHz
7020 to 7680 was spaced each 110 kHz
7680 to 8400 was spaced each 120 kHz
8400 to 8660 was spaced each 130 kHz
9050 and 9190 was spaced at 140 kHz
10200 to 10350 was spaced at 150 kHz
10350 to 10510 was spaced at 160 kHz.

Several frequencies that fell on the correct spacing were occupied by SW BC stations, so it is quite possible they were also used by the Pips, but not able to be received at my location.

I have seen these pips in the past, on discrete frequencies, but never realized they were on more than one frequency at a time.  I will be watching for them in the future, to see if they always use the same frequencies and what the upper and lower frequency limits might be, as well as if the frequency spacing stays predictable at all times.

T!

1917
Voice of Capt Ron SHortwave, 6930 USB.  Op got himself an RF Burn when he touched the hot wire.

I have the station at about S7 and fairly strong here in the Mojave Desert of California.  But audio is pinched and a little narrow.

T!

(edit)  ID 0258. Yeah Ron, normaly you are a little wider audio, did not recognize it at first because of that.

1918
Pirate Radio station on 6966 kHz CW, 0328 UTC, 04/15/2012

Radio Doom

"CQ Pirate Radio cooming soon doomsday on the air 2012.  radio doom cq pirate radio cq pirate radio coming soon doomsday on the air 2012 . . . radio doom."

T!

1919
North American Shortwave Pirate / Re: 6925 USB Red Mercury Labs
« on: April 14, 2012, 0417 UTC »
Really good signal into the Mojave Desert of California, S9 or a little better.  I was listening when Red Mercury first came up and was playing Johnny Cash (S6 or so then), but then the wife decided to make some strawberry shortcake, so I was out for a bit.  Came back to the Doors Peace Frog (S9 or so then).  Quite the swing in music ;)

T!

1920
You think that was a Beryllia ceramic in those tubes?  I would think an Aluminia ceramic more likely, maybe with some Mangenese.  I think BeO is mostly used in situations where some conductive cooling is part of the equation (such as internal supports that conduct heat or heat transfer blocks on some tubes), and the Aluminia when forced air is the methodology.

I don't know about the GU74B specifically, but I think BeO ceramic is a lot more rare than might be perceived.

T!

Pages: 1 ... 120 121 122 123 124 125 126 127 [128] 129 130 131 132 133 134 135 136 ... 145